11 reports plus an overview
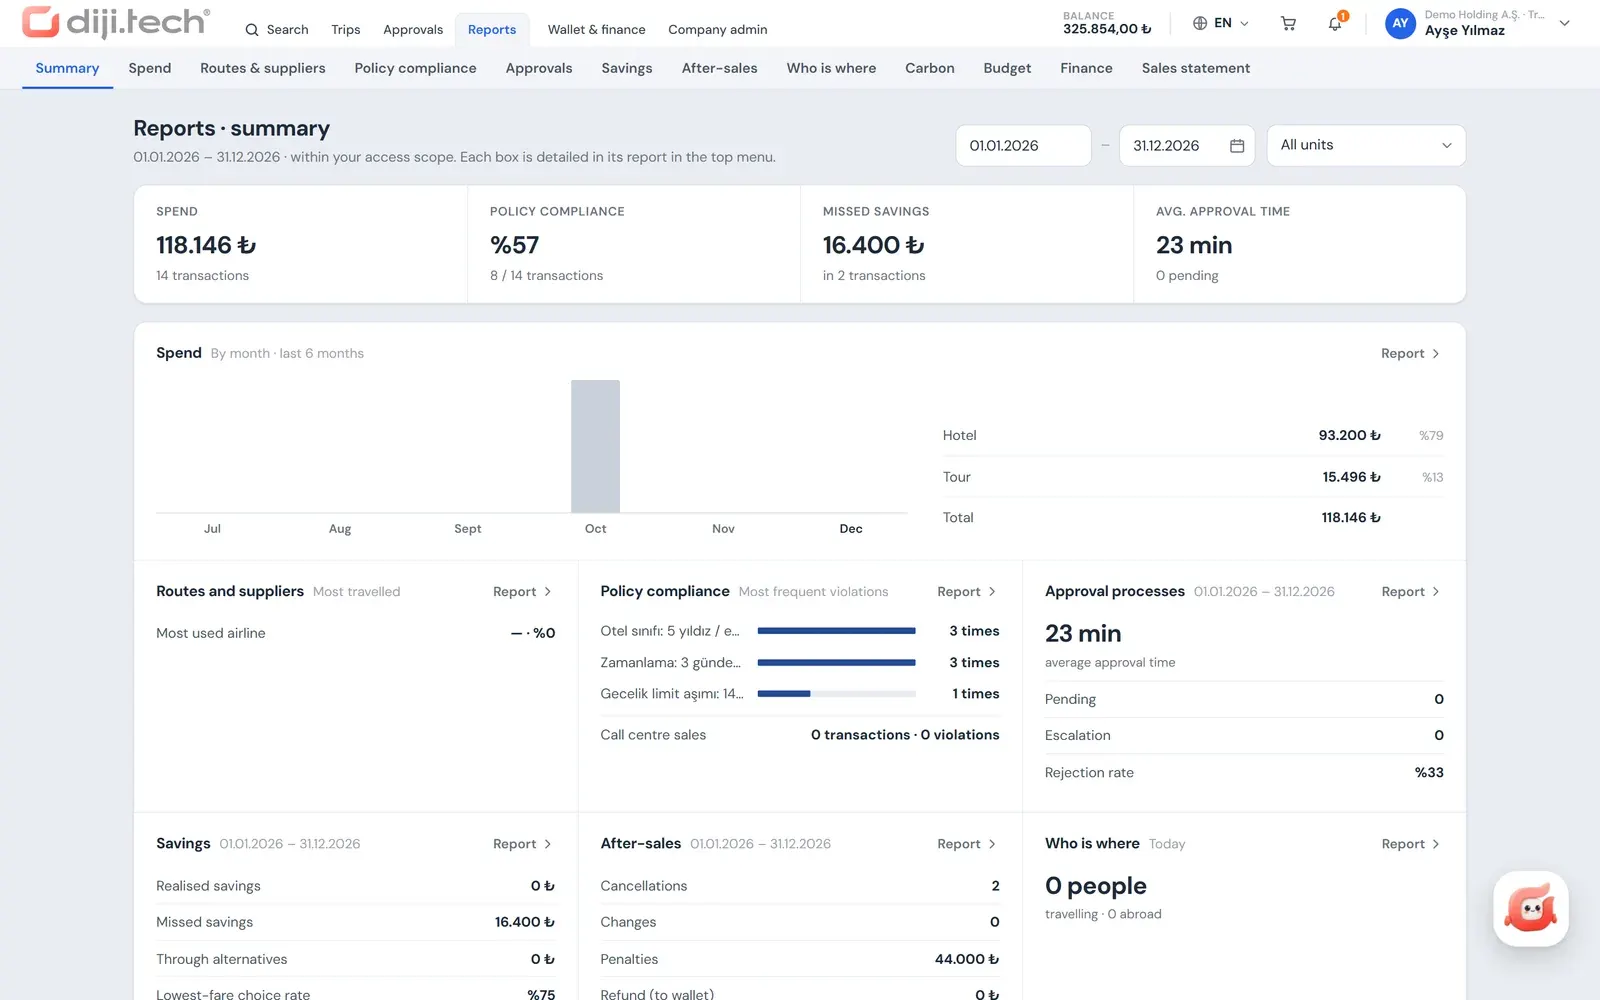
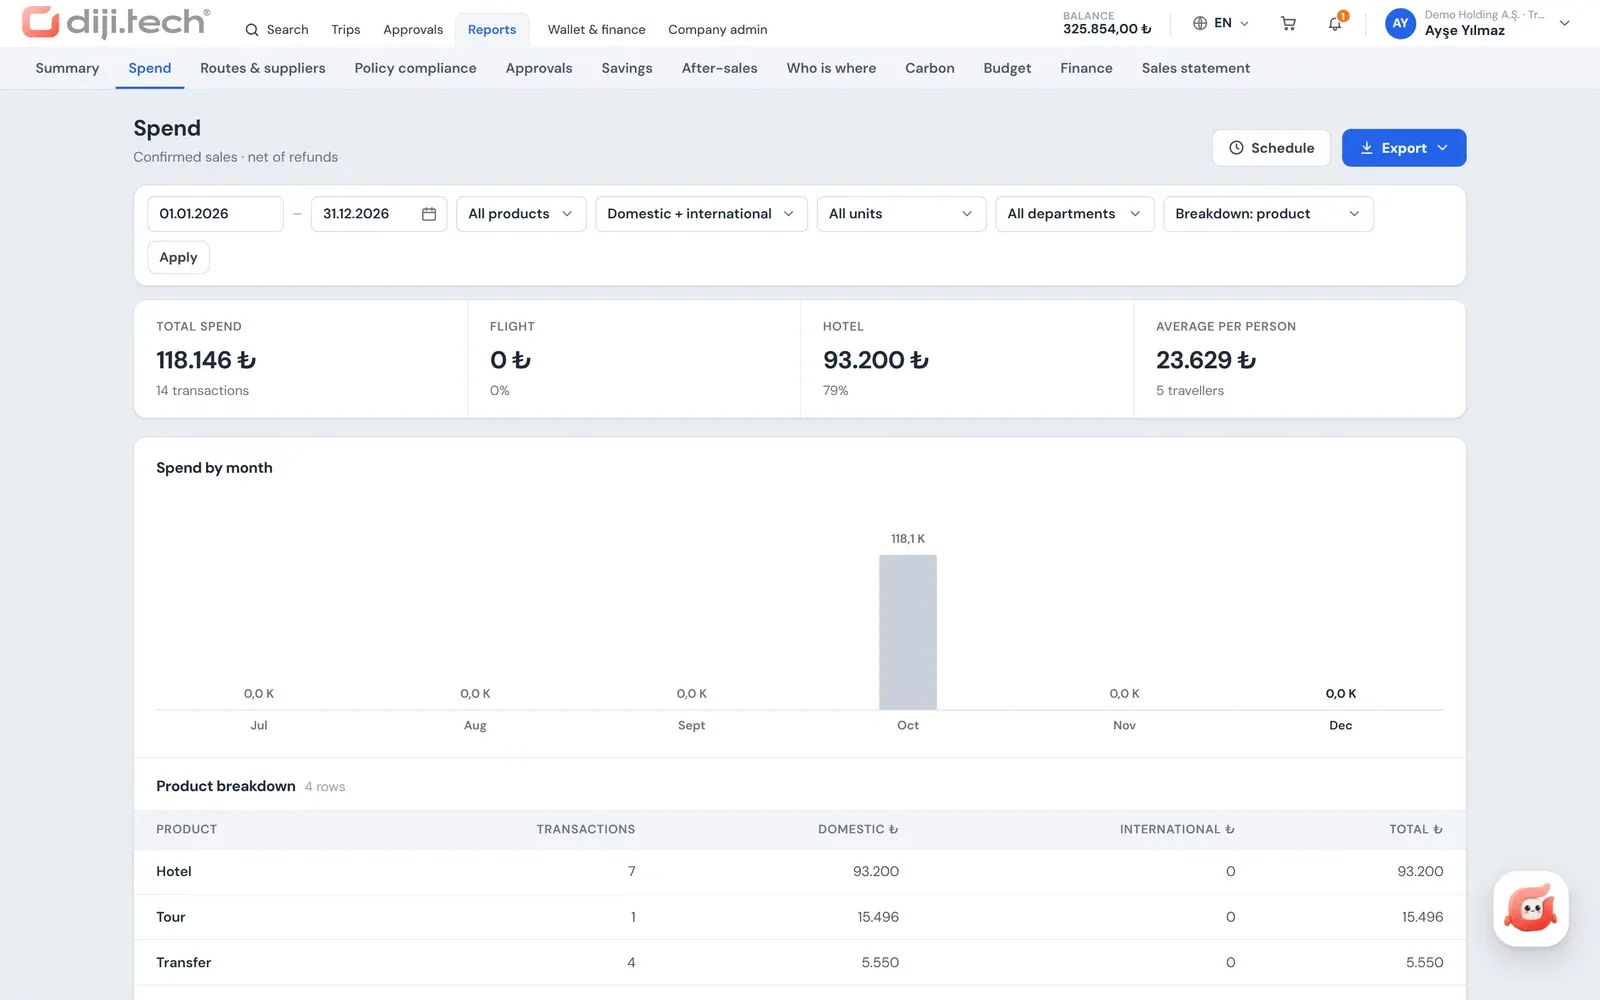
From spend to carbon, every report comes with a KPI strip, a chart and a table.
Data by scope
A department manager sees their department, a finance team sees the company; each report narrows to the role scope.
Scheduled emails
A monthly or weekly report reaches each recipient in the chosen format and with their own scope.
Savings visibility
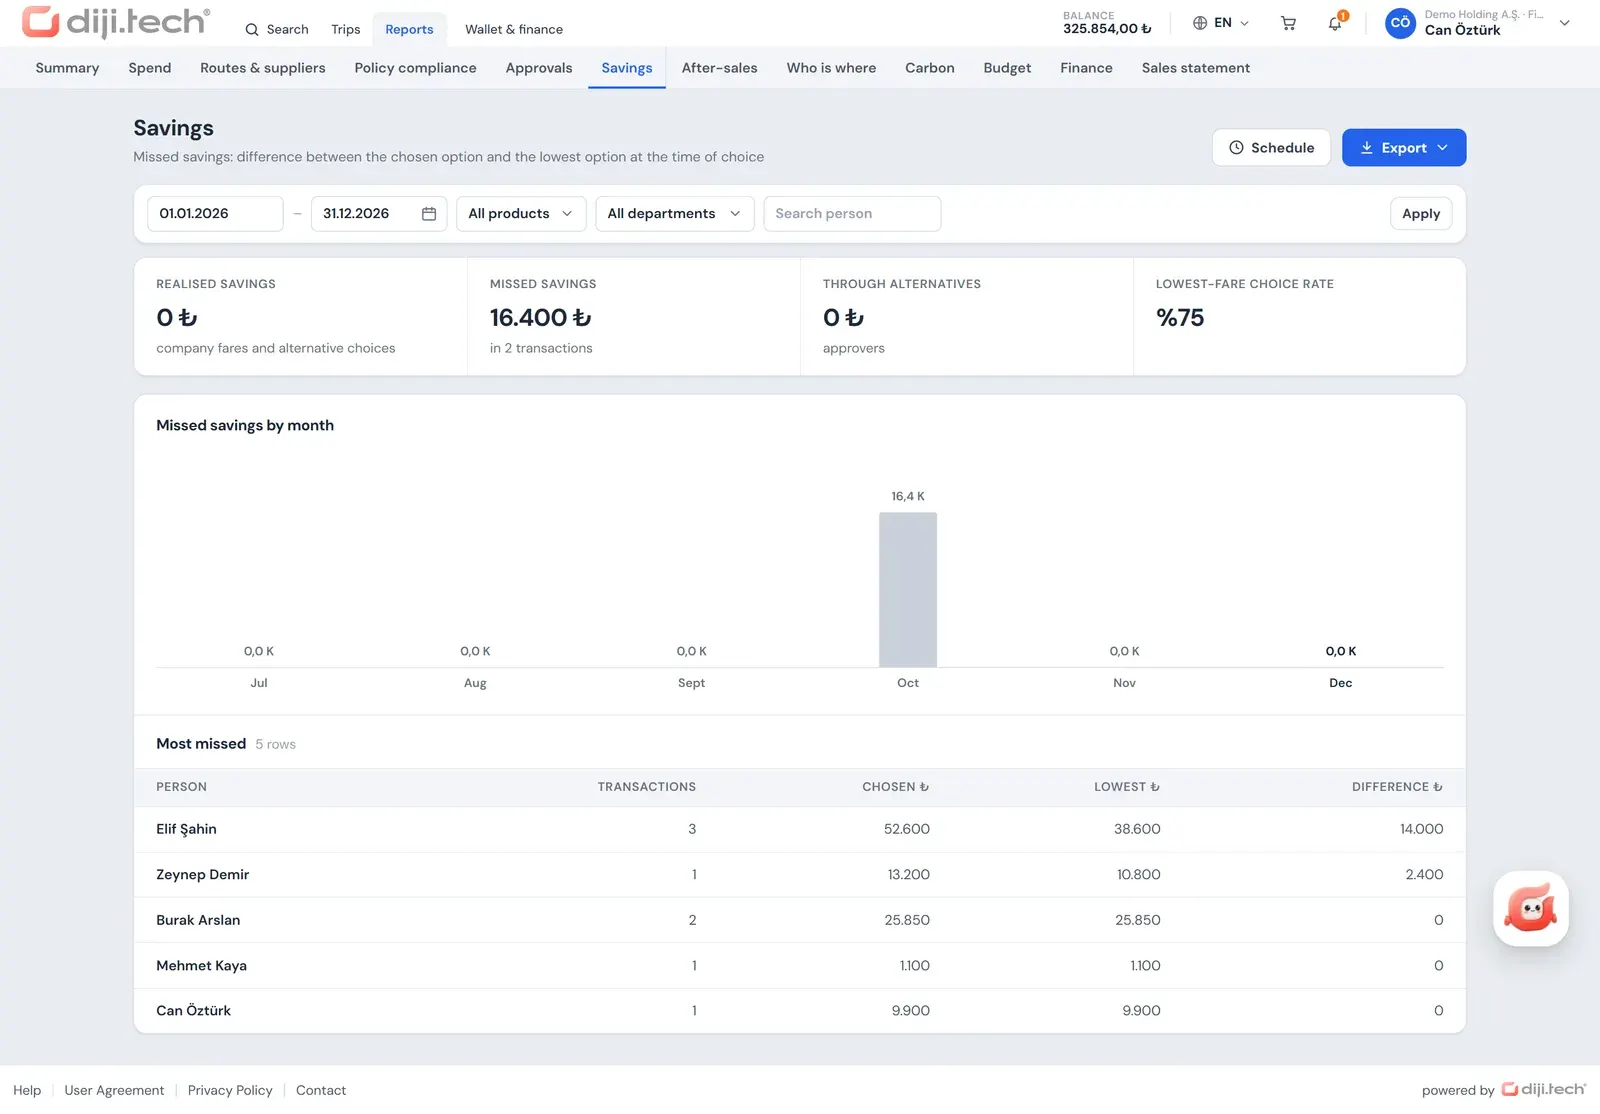
Realised and missed savings are tracked separately against the cheapest compliant option.
Corporate clients expect more from a travel agency than tickets and rooms: they want to know who travelled where, how much was spent and whether the rules were followed. Kurumsal.pro, running on DIJI.TECH infrastructure, answers these questions from booking data inside the portal your agency gives its corporate clients. Every sale made in the portal lands in the report tables on its own, with no merging in Excel, manual classification or month-end compilation.
What does corporate travel reporting cover?
Corporate travel reporting measures the trips made on behalf of a company across spend, compliance, approvals, budget, savings and impact. In the Kurumsal.pro portal this work consists of one overview page and 11 reports. Spend-oriented reports are built from confirmed transactions, the approvals report from approval request records; refunds are deducted from spend, and cancellations show up separately in the After-sales report.
The overview page gathers the main indicators of the period on a single screen: total spend and its change against the previous period, the policy compliance rate, missed savings and the average approval time. The home page of users in the manager, finance and report roles also carries spend, compliance, pending approval and wallet balance indicators, plus budget usage bars. A user who wants detail moves on to the relevant report.
Which 11 reports are in the portal?
Besides the overview page, the portal has 11 reports: Spend, Routes and suppliers, Policy compliance, Approvals, Savings, After-sales, Who is where, Carbon, Budget, Finance and Sales breakdown. Each answers a different management question and comes with a KPI strip, a chart, a detail table and an export button.
| Report | Question it answers | Key indicators |
|---|---|---|
| Spend | How much do we spend, and on what? | Total spend, flight and hotel share, average per person; breakdown by product, unit, department or person |
| Routes and suppliers | Where do we fly most, with which airlines and hotels? | Number of distinct routes, most travelled route, airline and hotel distribution |
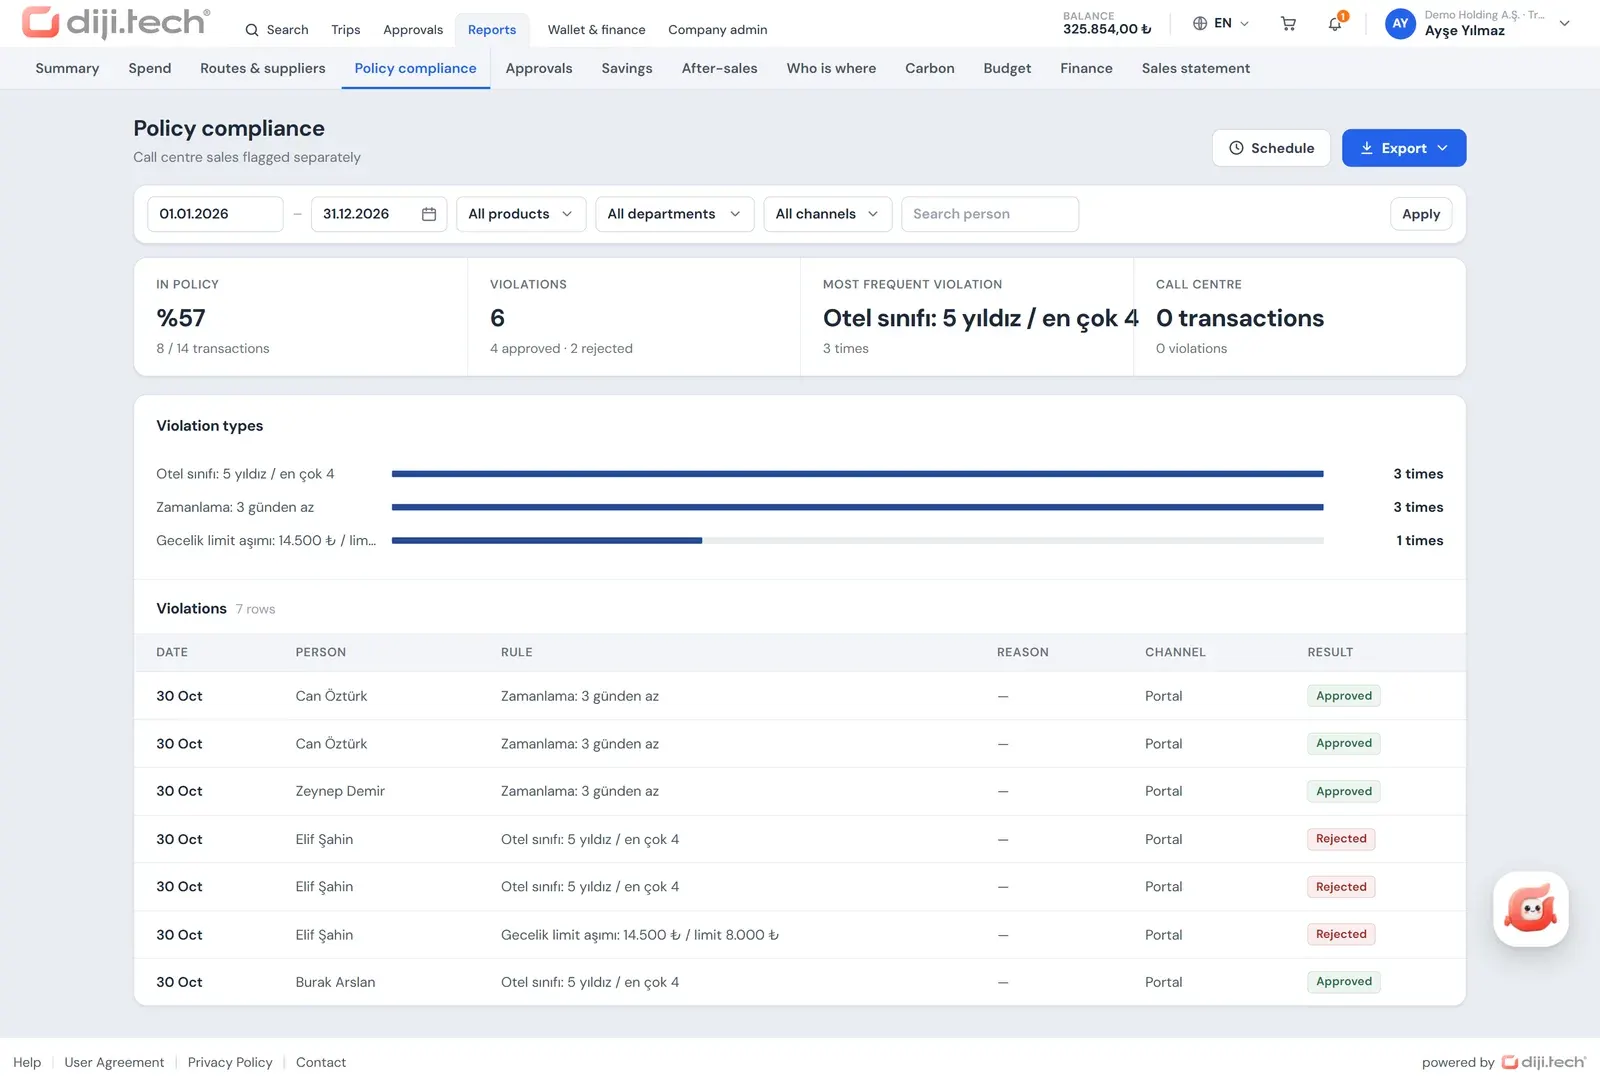
| Policy compliance | Do trips follow the rules? | In-policy rate, number of violations, most frequent violation, sales made by agency staff on behalf of the client |
| Approvals | How long do approvals take? | Average approval time, pending requests, escalations, rejection rate, time by approver |
| Savings | How far did we move from the cheapest option? | Realised savings, missed savings, share of cheapest-option choices, savings from choosing an alternative |
| After-sales | What did cancellations and changes cost? | Number of cancellations and changes, total penalties, refunds returned to the wallet |
| Who is where | Who is travelling today? | People travelling, people abroad, people on a flight today, cities |
| Carbon | What is the estimated emission of our trips? | Total and per-person estimate, flight and hotel share, distribution by department |
| Budget | Where do budgets stand? | Planned, committed, actual and remaining amounts |
| Finance | How are invoices and the wallet progressing? | Invoice count and total, wallet balance and outflow, distribution by billing profile |
| Sales breakdown | What exactly was bought, line by line? | Fare, service fee, VAT and total; by product the booking number, PNR, ticket number, route, hotel, nights, visa type and invoice number |
Filters vary by report: date range, product (ten products, from flights to visas), domestic or international, unit (company or branch), department, person and sales channel. In the Spend report the breakdown can be set to product, unit, department or person, so department-level cost analysis needs no extra tool.
If you want to know which metrics belong in a management meeting, we cover them in detail in how to prepare corporate travel reports.
Who sees the reports and how is the data limited?
Report access is controlled by two permissions. A person with the report view permission opens all 11 reports. A person with only the finance permission sees Spend, Savings, Budget, Finance and Sales breakdown. This split lets a finance team receive the financial picture without opening trip detail. Among the seven ready-made roles created automatically for every company are Finance and Report viewer, so the company administrator can hand out report access by assigning these roles without designing a new one.
The second layer is data scope. The role model in the portal knows seven scopes: the person themselves, specific people, their department, their branch, their company, their company and its sub-branches, and the whole organisation. Every report is narrowed to the scope in the role of the person who opens it. A department manager sees only the spend of their own department, while the finance team of a holding group sees all companies in one report. How roles and scopes are defined is described on the company admin panel page.
A single query can cover at most 370 days. That is enough to look at a full financial year in one report; for a comparison with the previous year, the same report is run for two separate periods.
How are reports exported and scheduled?
Every report exports to Excel (.xlsx), CSV and PDF. The table on screen shows the first rows, while the downloaded file contains all records for the selected filters. Accounting takes the Excel file into its own sheets, and management drops the PDF into a presentation.
For recurring needs a scheduled report is set up:
- Frequency: A monthly email goes out at 08:00 on the first day of the month and covers the previous month; a weekly email goes out at 08:00 every Monday and covers the previous week. Times are Istanbul time.
- Format: Excel, CSV or PDF.
- Recipients: Chosen from the people in the portal. Each recipient receives the report with their own authority scope; the report sent to a department manager contains only their department.
- Management: Scheduled reports appear in one list, and a schedule that is no longer needed is removed after confirmation.
The practical side of scheduling, distribution and report automation is covered in automated travel reporting.
What does the Savings report measure?
The Savings report measures the gap between the option chosen and the cheapest compliant option defined in the policy for that search. Realised savings shows the amount gained through the corporate price and through an approver choosing a cheaper alternative; missed savings shows the difference created when a more expensive option was bought instead of the cheapest one. Next to them sit the share of cheapest-option choices and the savings achieved by choosing an alternative.
The definition of "cheapest option" is made in the travel policy. For flights it covers the departure time window (plus or minus 2 hours, plus or minus 4 hours or the same day), the maximum number of stops, and conditions such as the same cabin and baggage included. The savings figure is therefore calculated against the criterion the company itself has accepted. The details of the rules are on the travel policy software page.
The report is not a recommendation engine; it shows what happened and does not suggest what to do. The interpretation and the action are decided together by company management and your agency.
How is the Carbon report calculated?
The Carbon report shows the estimated greenhouse gas emissions of trips as tonnes of CO2e by product, department and person. The calculation is an estimate based on official conversion factors, not a measurement, and it uses three methods depending on the product:
- Flights: flight distance multiplied by a cabin factor. The factors rely on the greenhouse gas conversion factors for company reporting that the UK Department for Energy Security and Net Zero (DESNZ, often still called DEFRA factors) publishes. The set separates flights into domestic, short-haul and long-haul and gives a different factor per seat class (2026 methodology report, accessed 4 November 2026).
- Hotels: number of nights multiplied by a country factor.
- Cars and transfers: estimated kilometres multiplied by a vehicle class factor.
The method note on the report says clearly that the figures are estimates and that actual fuel or energy consumption from the supplier is not used. The factors are managed by the platform; neither a company nor an agency changes them on screen. We explain the method with examples in how business travel CO2 emissions are calculated.
What does the Who is where report show?
The Who is where report lists, from confirmed travel records, the people travelling today, the people abroad and the people on a flight today. The table includes the person, department, city, accommodation, return date and phone number, and a distribution chart by city accompanies it.
This report is not a location tracking tool. Device location, GPS and live flight status are not used; only reservations confirmed in the portal count. In an emergency it gives a quick starting point for the question "who do we have in that city?", but it does not replace a duty of care solution. The legal and operational framework is discussed in duty of care in business travel.
How do the Budget and Finance reports work together?
The Budget report shows the planned, committed, actual and remaining amounts of department, company or branch budgets. The amount of a request sent for approval is deducted as a commitment; it turns into actual spend on purchase and is released on rejection or cancellation. This ledger logic is detailed on the travel budget control page.
The Finance report shows invoice count and total, the wallet balance and the wallet outflow in the period, and breaks invoice totals down by billing profile. The Sales breakdown gives accounting the line-level data it needs: fare, service fee, VAT, total and, by product, the PNR, ticket number, hotel, number of nights or visa type. How to track employee flight and hotel spend with these reports is explained in tracking employee flight and hotel spend. A user with the finance permission reaches the same data in detail from the portal's Wallet and finance screen, where the balance, the transaction ledger, the monthly statement and the invoice list are gathered. The invoice and payment side is on the corporate travel payments and invoicing page.
Which reports does the agency see?
The agency panel has separate reports for the corporate channel. The sales and profit report shows sales and profit per client company layer by layer: commission, the company price layer and the service fee. The sales channel is split into the corporate portal and sales made by agency staff on behalf of the client. The policy compliance report lists violations from portal sales and from sales your staff made from the panel separately; it can be taken as Excel, CSV or PDF.
The client sales breakdown covers the company and its sub-companies for up to 370 days by product, unit and user; markup and commission are not visible in it. The agency can also email this breakdown to the client's accounting address at regular intervals; its use in reconciliation is described on the corporate travel payments and invoicing page. These reports make the regular account conversation with a corporate client easier; the details are on the corporate travel agency software page.
Can reports be produced with Diji?
Yes. Diji, the AI assistant inside the portal, works with the staff member's own permissions and can produce a report, a table or a chart from a chat. Reports prepared by Diji are stored with their versions on a separate page in the portal and can be shared within the company. Diji does not reach any data the user cannot see; the role scope applies here as well. See the AI travel assistant page for details.
How does reporting connect to the rest of the portal?
Reports are the natural output of the search, cart, policy, approval and budget steps inside a corporate travel management software platform. The compliance report exists because the policy decision is stored permanently at cart submission, the approvals report because approval movements are recorded, and the budget report because the budget ledger is kept. The corporate client only reads the report; the accuracy of the data comes from running the processes in a single portal.
To see how the reports look in a live environment, you can request a demo.
Screens
1 / 4
2 / 4
3 / 4
4 / 4
Screens are taken from the DIJI.TECH corporate portal and agency panel and show sample data.
Frequently asked questions
What is corporate travel reporting?
Corporate travel reporting means collecting flight, hotel, transfer, car and other travel spend made on behalf of a company into one source and reporting it by spend, policy compliance, approvals, budget and savings. In Kurumsal.pro the reports are fed by bookings made in the portal, so no separate data entry is needed.
Which reports does the corporate portal include?
On top of the overview page there are 11 reports: Spend, Routes and suppliers, Policy compliance, Approvals, Savings, After-sales, Who is where, Carbon, Budget, Finance and Sales breakdown. Each report has a KPI strip, a chart, a table and an export button.
Who can see which report?
A person with the report view permission opens all 11 reports. A person with only the finance permission sees Spend, Savings, Budget, Finance and Sales breakdown. In both cases the data is limited by the scope in the person's role, for example their department or company.
Which formats can reports be downloaded in?
Every report exports to Excel (.xlsx), CSV and PDF. The table on screen shows the first rows; the exported file contains all records for the selected filters.
How do scheduled reports work?
A report is scheduled with its filters and recipients are added. A monthly email goes out at 08:00 on the first day of the month and covers the previous month; a weekly email goes out at 08:00 on Monday and covers the previous week. Times are Istanbul time. Each recipient receives the report with only the data inside their own scope.
How is the carbon report calculated?
For flights the distance is multiplied by a cabin factor, for hotels the number of nights by a country factor, and for cars and transfers the estimated kilometres by a vehicle class factor. The flight factors rely on the distance bands in the conversion factors the UK government publishes for company reporting. The results are estimates, not measurements.
Does the Who is where report track employee location?
No. The report uses confirmed travel records to show who is travelling today, who is abroad, who is on a flight today and the city distribution. Device location, GPS and live flight status are not used, and it is not a duty of care solution.
Which reports does the agency see on its side?
The agency panel has a sales and profit report per client company, a policy compliance report that separates portal sales from panel sales, and a client sales breakdown. The sales breakdown can also be emailed to the client's accounting contact address at the frequency the agency chooses.
Related pages
Last updated: